Research Questions:
- Is there any relationship between No.of MSME Units and Employment Generated in Telangana
- Is there any Relationship between Amounts Invested and Employment Generated in Telangana
- Is there any Impact/Effect of No. of MSME Units and Amounts Invested on Employment Generated by the MSMEs?
Consider the Following Data Table: comprises Number of MSMEs started, Amount Invested and Employment Generated in Telangana state during 2015-2017.
Table-1: MSME Units Data in Telangana State (2015-2017)
| Sl.No. | District | Number of MSMEs | Investment Amount (Crores) | Employment Generated (nos.) |
| 1 | Rangareddy | 3,488 | 2,230.1 | 33,961 |
| 2 | Karimnagar | 1,571 | 1,406.7 | 19,480 |
| 3 | Hyderabad | 1,494 | 941.7 | 14,380 |
| 4 | Nalgonda | 960 | 690.2 | 8,425 |
| 5 | Medchal-Malkajgiri | 928 | 516.2 | 8,019 |
| 6 | Medak | 732 | 981.1 | 10,565 |
| 7 | Mahabubnagar | 437 | 399.6 | 3,862 |
| 8 | Nizamabad | 429 | 429.8 | 4,076 |
| 9 | Khammam | 397 | 357.5 | 4,011 |
| 10 | Adilabad | 384 | 359.8 | 4,607 |
| 11 | Sangareddy | 278 | 296 | 3,422 |
| 12 | Rajanna Sircilla | 248 | 80 | 2,058 |
| 13 | Yadadri Bhuvanagiri | 164 | 154.9 | 1,377 |
| 14 | Warangal Urban | 123 | 143.7 | 1,642 |
| 15 | Siddipet | 113 | 160.3 | 1,015 |
| 16 | Suryapet | 84 | 55.1 | 670 |
| 17 | Peddapalli | 60 | 26.6 | 791 |
| 18 | Jagtial | 55 | 13.5 | 255 |
| 19 | Warangal Rural | 47 | 67.1 | 509 |
| 20 | Wanaparthy | 44 | 17.2 | 279 |
| 21 | Mancherial | 39 | 29.3 | 347 |
| 22 | Badradri Kothagudem | 32 | 14.6 | 246 |
| 23 | Nagarkurnool | 32 | 13.2 | 189 |
| 24 | Vikarabad | 29 | 32.4 | 380 |
| 25 | Jogulamba Gadwal | 28 | 10.3 | 202 |
| 26 | Kumuram Bheem | 24 | 29.2 | 249 |
| 27 | Jayashankar | 22 | 23.7 | 247 |
| 28 | Mahabubabad | 15 | 12.1 | 202 |
| 29 | Jangaon | 13 | 25.9 | 148 |
| 30 | Kamareddy | 13 | 15.2 | 103 |
| 31 | Nirmal | 11 | 21.7 | 144 |
| Total | 12,294 | 9,554.4 | 1,25,861 |
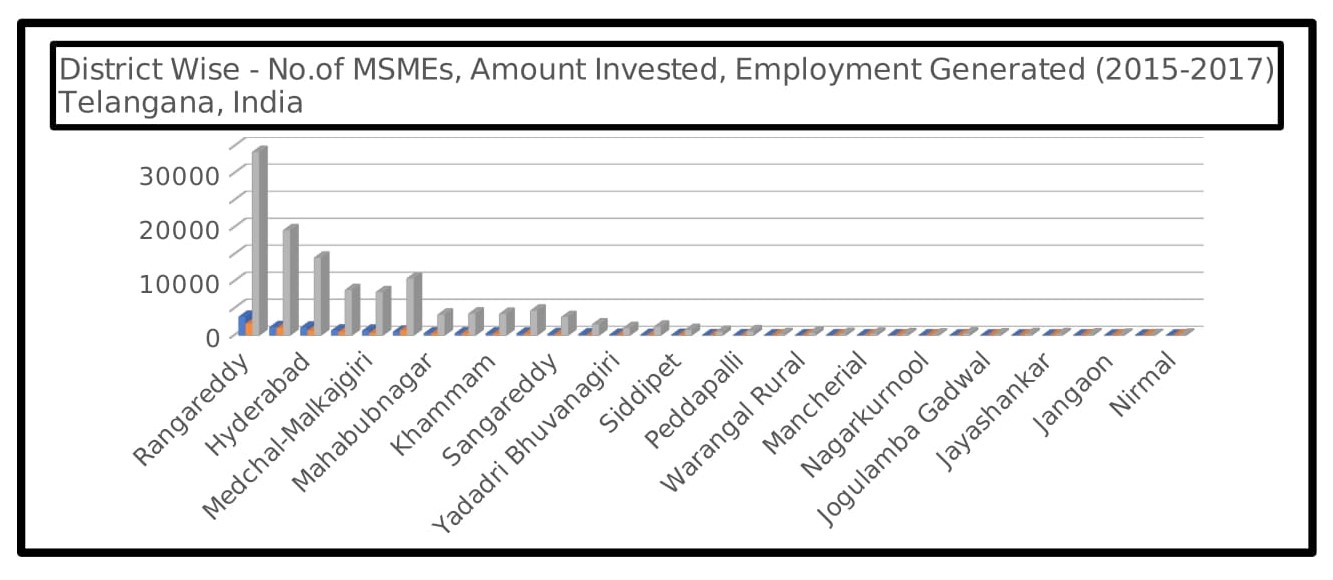
Figure-1: Telangana Districts – Employment Generated (2015-2017)
Data Analysis:
- Maximum Employment Generated (more than 10,000 Jobs each) in 4 districts; they were Ranga Reddy, Karimnagar, Hyderabad and Medak.
- These are the 4 Districts were Maximum Investment also went in. These four Districts have experienced investments of More than Rs 900 crore each.
- That means, On Average if we Invest around Rs 900 crore in India (as on 2015-2020), we can generate around 10,000 Jobs.
- From the Data of these districts, specifically the four districts, we can infer that the Amount Invested is Strongly Correlated to Number of Employment Generated. This we can observe from Correlation Matrix as well (Table-2).
Correlation Matrix:
Table-2: Correlation Matrix
| Number of MSMEs | Amount Invested | Employment Generated | |
| Number of MSMEs | 1 | ||
| Amount Invested | 0.970839 | 1 | |
| Employment Generated | 0.990223 | 0.990421721 | 1 |
Regression Matrix:
Table-3: Regression Table
| SUMMARY OUTPUT | ||||||||
| Regression Statistics | ||||||||
| Multiple R | 0.997622 | |||||||
| R Square | 0.99525 | |||||||
| Adjusted R Square | 0.994911 | |||||||
| Standard Error | 515.7499 | |||||||
| Observations | 31 | |||||||
| ANOVA | ||||||||
| df | SS | MS | F | Significance F | ||||
| Regression | 2 | 1.56E+09 | 7.8E+08 | 2933.416 | 2.98E-33 | |||
| Residual | 28 | 7447944 | 265998 | |||||
| Total | 30 | 1.57E+09 | ||||||
| Coefficients | Standard Error | t Stat | P-value | Lower 95% | Upper 95% | Lower 95.0% | Upper 95.0% | |
| Intercept | -222.614 | 111.0664 | -2.00433 | 0.054793 | -450.123 | 4.895488 | -450.123 | 4.895488 |
| Number of MSMEs | 5.06772 | 0.551674 | 9.18607 | 6.06E-10 | 3.937666 | 6.197774 | 3.937666 | 6.197774 |
| Amount Invested | 7.374326 | 0.791955 | 9.311547 | 4.54E-10 | 5.75208 | 8.996572 | 5.75208 | 8.996572 |
T-Test (No.of MSMEs and Employment Generated):
Table-4: T-Test-1 (No.of MSMEs and Employment Generated)
| t-Test: Two-Sample Assuming Unequal Variances | ||
| Number of MSMEs | Employment Generated | |
| Mean | 396.5806452 | 4060.032258 |
| Variance | 506922.9183 | 52267120.3 |
| Observations | 31 | 31 |
| Hypothesized Mean Difference | 0 | |
| Df | 31 | |
| t Stat | -2.807767369 | |
| P(T<=t) one-tail | 0.004276448 | |
| t Critical one-tail | 1.695518783 | |
| P(T<=t) two-tail | 0.008552897 | |
| t Critical two-tail | 2.039513446 |
T-Test (No.of MSMEs and Amount Invested):
Table-5: T-Test-1 (No.of MSMEs and Amount Invested)
| t-Test: Two-Sample Assuming Unequal Variances | ||
| Number of MSMEs | Amount Invested | |
| Mean | 396.5806452 | 307.8064516 |
| Variance | 506922.9183 | 245999.3613 |
| Observations | 31 | 31 |
| Hypothesized Mean Difference | 0 | |
| df | 54 | |
| t Stat | 0.569629547 | |
| P(T<=t) one-tail | 0.285645586 | |
| t Critical one-tail | 1.673564906 | |
| P(T<=t) two-tail | 0.571291172 | |
| t Critical two-tail | 2.004879288 |
Further Findings:
- From Correlation Matrix, we can Infer that Both Number of MSMEs we setup and Amount of Money We Invested both are Highly Strongly Correlated to Employment Generated (both have >0.99 Correlation Coefficient Value)
- Among Number of MSMEs and Amount Invested, Amount Invested is More Strongly Correlated to Employment Generated than the Number of MSMEs setup
- That means, How many number of Business Units we setup is not Important, more important is How Much Money We invested is More Important in Order to Generate More number of Jobs.
- Coming to Regression Results, both Number of MSME Units and Amount Invested have Effect over the Employment Generated.
- That means, the change in Number of MSMEs or the Change in Amount Invested effects the Number of Jobs Created
- From T-Test-1 Results We can Infer that Number of MSMEs setup is having effect over Employment Generated (t-test two tailed value is within tabulated values of -2.802 and +2.802) (Here P-values are <0.05 indicating significant). That means, The More is the Number of MSMEs we setup leads to more jobs creation.
- From T-Test-2 Result, we can infer that Number of MSMEs started is nothing to do with Amount Invested. (t-test two tailed critical value is not within -0.572 and +0.572). P-values also came higher. It indicates few MSMEs may invest huge money or Many MSMEs can invest huge money. That means, numbers of MSMEs is not the key, Amount invested is key for Employment Generation.
Hope this is Useful.
Best wishes,
Dr.Goparaju Purna Sudhakar
References:
- Source: “Socio Economic Outlook-2018”, Planning Department, Govt. Telangana, India, 2018