Research Questions:
1. Which factor among State GDP, GDP growth rate, Population, Geographical area, and Per Capita Income in the state is the reason for Population Density in the State?
2. Does Most Populous States experience lesser growth rate?
3. Is Per Capita Income the Reason for Population Density in a State?
Introduction: Usually in Certain Places, Population Density will be very high. What is the reason for this Phenomena? Is it because of GDP in the state or GDP growth rate, Total Population in State, Geographical area of State or Per Capita income in State; because of which Population Density is higher. One More thing is whether Most Populous states Experience Lesser GDP growth rates because of its size. Is the Per Capita Income is the Main Reason for Population Density in the state. These questions are answered in this Data Insight.
Please consider the data in Table-1. The Table Comprises Fields such as Selected State Names, GSDP (Gross State Domestic Product), GSDP growth rate, State Total Population, Geographical area in Sq. Kms, Per Capita Income in State and Population Density per Sq. Km. The Table-1 Comprises 20 Different States Data. Simple Correlation and Regression Techniques are applied on the Data. Please see the Correlation and Regression Results in Table-2 and Table-3.
In this Research Problem, Independent Variables include GSDP, GSDP Growth Rate, State Total Population, Geographical Area and Per Capita Income. Dependent Variable is Population Density. We need to examine the Effect or Relationship of Independent Variables over Dependent Variables in the Research Problem.
Table-1: List of Selected Indian States (based on 2011 Census)
| Sl.No. | State/Union Territory | GSDP (2011–12) (Rs. Billions) | GSDP Growth Rate (%) (2012) | State Total Population (2011) (Millions) | Geographical Area (sq.kms) | Per Capita Income in the State (2012) (Rs) | Population Density (2011) (per sq. km) |
| 1. | Andhra Pradesh | 3,794 | 10.00 | 75.7 | 275,352 | 78,735 | 397 |
| 2. | Assam | 1,432 | 9.56 | 26.6 | 78,438 | 38,945 | 397 |
| 3. | Bihar | 2,471 | 14.25 | 82.9 | 94,163 | 26,948 | 1102 |
| 4. | Chandigarh | 188 | 15.13 | 0.9 | 114 | 141,926 | 9252 |
| 5. | Chhattisgarh | 1,581 | 12.3 | 20.8 | 135,192 | 53,815 | 189 |
| 6. | Delhi | 3,438 | 13.84 | 13.8 | 1,484 | 192,587 | 11297 |
| 7. | Gujarat | 6,156 | 17.69 | 50.6 | 196,024 | 93,046 | 308 |
| 8. | Haryana | 2,975 | 16.63 | 21.1 | 44,212 | 119,833 | 573 |
| 9. | Himachal Pradesh | 727 | 13.89 | 61 | 55,673 | 83,899 | 123 |
| 10. | Jharkhand | 1,509 | 15.77 | 26.9 | 79,716 | 40,238 | 414 |
| 11. | Karnataka | 6,060 | 14.75 | 52.7 | 191,791 | 76,578 | 319 |
| 12. | Kerala | 3,640 | 13.26 | 31.8 | 38,863 | 91,567 | 859 |
| 13. | Madhya Pradesh | 3,156 | 20.71 | 60.4 | 308,252 | 43,426 | 236 |
| 14. | Maharashtra | 12,804 | 14 | 96.7 | 307,713 | 103,991 | 365 |
| 15. | Odisha | 2,310 | 13.3 | 36.7 | 155,707 | 49,227 | 269 |
| 16. | Punjab | 2,666 | 11.67 | 24.3 | 50,362 | 84,526 | 550 |
| 17. | Rajasthan | 4,348 | 13.5 | 56.5 | 342,239 | 60,844 | 201 |
| 18. | Tamil Nadu | 7,515 | 13.75 | 62.1 | 130,058 | 98,628 | 555 |
| 19. | Uttar Pradesh | 7,241 | 13.58 | 166.0 | 240,928 | 33,482 | 828 |
| 20. | West Bengal | 5,205 | 13.64 | 80.2 | 88,752 | 60,318 | 1029 |
Table-2: Correlation Matrix
| GSDP | GSDP Growth Rate (%) | State Total Population | Geographical Area | Per Capita Income | Population Density | |
| GSDP | 1 | |||||
| GSDP Growth Rate (%) | 0.076706754 | 1 | ||||
| State Total Population | 0.609849807 | -0.011978156 | 1 | |||
| Geographical Area | 0.559428195 | 0.152574092 | 0.577928834 | 1 | ||
| Per Capita Income | 0.081441802 | 0.073561488 | -0.43112834 | -0.393296204 | 1 | |
| Population Density | -0.217508458 | 0.039061566 | -0.37378756 | -0.472625442 | 0.752427386 | 1 |
Results Discussion:
- Among all the Independent Variables Related to Population Density, Per Capita Income is the Highly Correlated Variable. There is a Strong Positive Relationship between Per Capita Income and Population Density in State (Correlation Coefficient: 0.7524). Further Correlation Table States that GSDP, State Total Population and Geographical Area have got Nothing to do with Population Density in State. There variables are not related to Population Density at all because of Negative Correlation. It is Only because Per Capita Income was High, That Lead to Higher Population Density in that area.
- Come to the Second Important Finding from the Correlation Table. Observe the Column related to GSDP. It indicates that State Total Population and Geographical Area are Strongly Correlated to GSDP to compare with any other variables. That Means Population and Geography are the Reasons for Higher GDP. This is also same as the Typical Economics Research. The Higher the Population and Geographical area, the greater would be the Country GDP as well. Generic Macro Economics Research also Proved this Historically.
- In the Same, GSDP column, Observe that Population Density has negative Relationship with GSDP. Population Density has nothing to do with GSDP. That Means, the higher the Population Density in State does not mean that that state will have greater GDP.
- Observe the Row, of Per Capita Income in the Correlation Table, It indicates that None of the Variables such as GSDP, GSDP growth rate, State Total Population or Geographical Area are related strongly to Per Capita Income. That means, Per Capita income is because of some other variables such as Investments in the area, Savings in the Area, Literacy in the areas, Skill Level in the area, Employment rate in the area and Technology Usage in the area.
- Similarly, None of the Variables in Correlation table are the Strong Reasons for GSDP growth rate; story is same as Point no.4). That means, the aspects specified above such as investments, literacy, skills, employment, technology….are the reasons for GSDP growth rate as well. These are the same reasons for higher Per Capita Income. Let’s move on to Regression Table-3.
Table-3: Regression Table
| SUMMARY OUTPUT | ||||||||
| Regression Statistics | ||||||||
| Multiple R | 0.83021 | |||||||
| R Square | 0.689249 | |||||||
| Adjusted R Square | 0.578267 | |||||||
| Standard Error | 1976.939 | |||||||
| Observations | 20 | |||||||
| ANOVA | ||||||||
| df | SS | MS | F | Significance F | ||||
| Regression | 5 | 1.21E+08 | 24272173 | 6.210437 | 0.003098 | |||
| Residual | 14 | 54716026 | 3908288 | |||||
| Total | 19 | 1.76E+08 | ||||||
| Coefficients | Standard Error | t Stat | P-value | Lower 95% | Upper 95% | Lower 95.0% | Upper 95.0% | |
| Intercept | -3592.96 | 2985.743 | -1.20337 | 0.248787 | -9996.74 | 2810.821 | -9996.74 | 2810.821 |
| GSDP | -0.49197 | 0.253836 | -1.93813 | 0.073043 | -1.03639 | 0.052458 | -1.03639 | 0.052458 |
| GSDP Growth Rate | 22.95226 | 188.3853 | 0.121837 | 0.90476 | -381.094 | 426.9984 | -381.094 | 426.9984 |
| State Total Population | 27.57774 | 19.45885 | 1.417234 | 0.178284 | -14.1573 | 69.31283 | -14.1573 | 69.31283 |
| Geographical Area | -0.00124 | 0.006173 | -0.20101 | 0.84358 | -0.01448 | 0.012 | -0.01448 | 0.012 |
| Per Capita Income in the State | 0.06883 | 0.01568 | 4.389604 | 0.000617 | 0.035199 | 0.102461 | 0.035199 | 0.102461 |
Results Discussion:
The regression result indicates that Per Capita income is only the Variable among all Independent Variables effecting or impacting Population Density (p-value<0.05). That means in reality, if Per Capita Income is very less, that may lead to People Migration as well to the Prosperous areas. If Per Capita Income is High, People gather More, leading to Higher Population Density.
Other Reasons for Population Density:
Other Reasons for Higher Population Density in a State can be i) Capital Invested in the State, ii) Ease of Doing Business, iii) Length of Highways in the State.
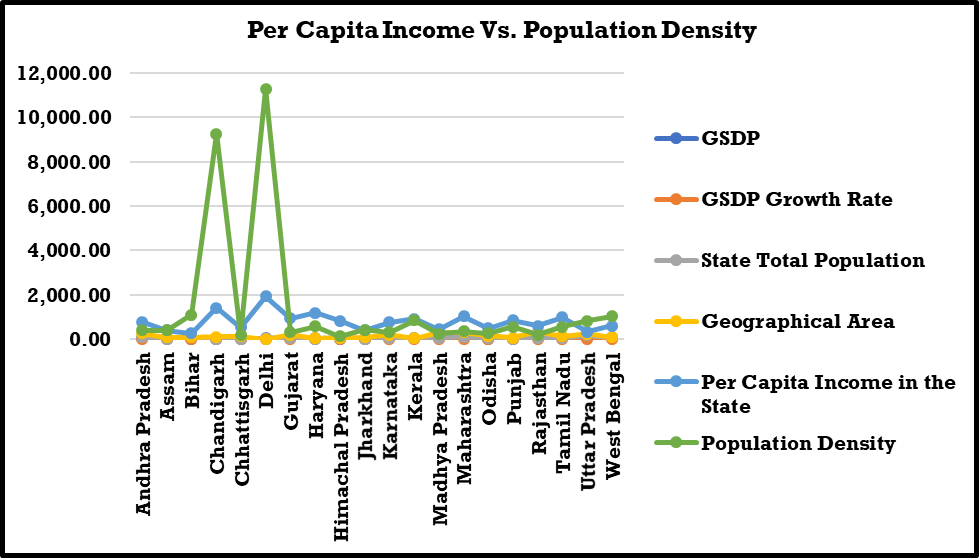
Figure-1: Per Capita Income Vs. Population Density
Critical Observation:
One more thing is Highest Per Capita income may lead to Higher Population Growth or Higher Population Density in the Area; For Example, In 2025, Ranga Reddy District in Telangana has Per Capita Income of Rs 11 Lakh/year (highest in India); and The Same District has the most Populous Parliamentary Constituency (Chevella) /and the Most Populous Assembly Consistency (Serilingampally) in Telangana state. Thus, Research Question-3 is answered in reality as well. Not only this, Take Delhi and Chandigarh, both have Higher Per Capita Income and Higher Population Density (Refer Table-1). But reverse may not be TRUE. That is, Having Highest Population may not lead to Highest Per Capita Income in the Region. For Example, West Bengal, Bihar, UP were Having Higher Population Density in States, but they were having relatively Lower Per Capita Incomes.Thus, One Can Understand the Relationship Between Per Capita Income and the Population Density of the Region. The Higher is the Per Capita Income, the Higher will be the Population Density. But, On the Other way, Higher Population Density May not Mean One has Higher Per Capita Income. The Exception is Kerala. That is Despite Having Higher Population Density, they have Higher Per Capita Income relatively. The Reason could be Better Literacy Rate, Better Employment Rate, Better Occupancy Rate, Better Investments, etc in Kerala.
Please take this in academic/research point of view only. Data Considered as Example here is also of 2011 Census and 2012s; this is just to showcase the power of data analytics.
Hope You Understand.
Best wishes,
Dr.Goparaju Purna Sudhakar
(https://gpsudhakar.com)
References: